A pod goes into CrashLoopBackOff. You pull the logs expecting a stack trace, a panic, an error string – anything that points you somewhere. Instead you get one line:
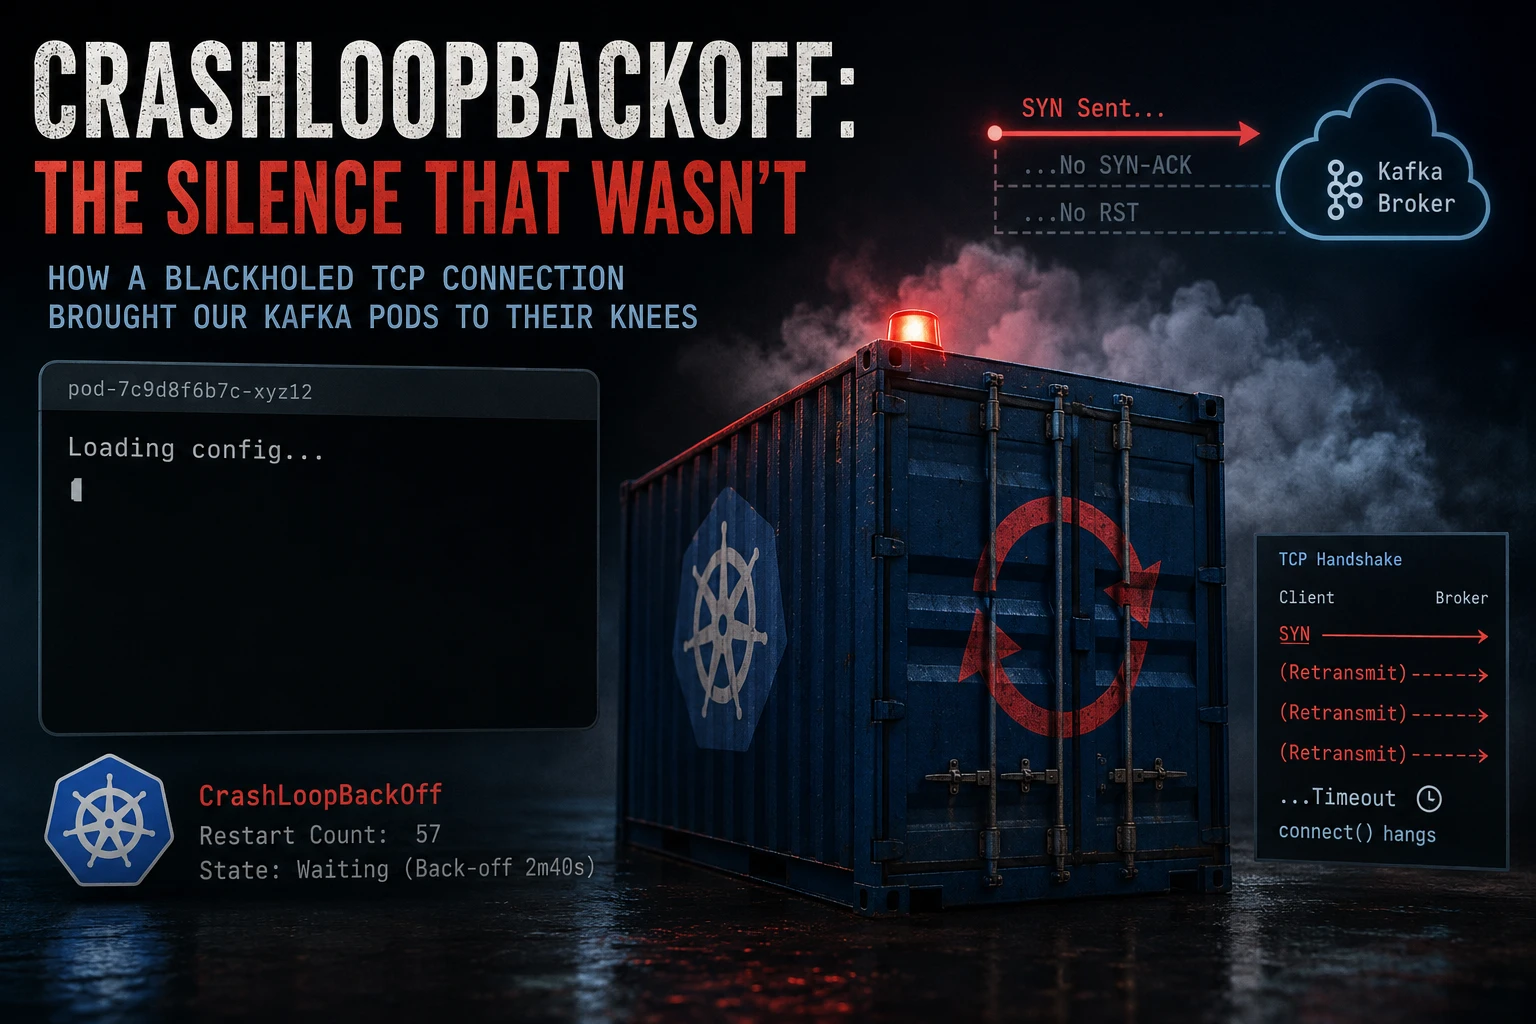
Loading config...And then nothing. No error. No exit message. The container is just gone, and a few seconds later it’s back, prints the exact same line, and disappears again. Magic. This is the story of chasing that silence to its root cause. TCP connection that was never going to succeed, and never going to fail either. At least not on any timescale a Kubernetes health check was willing to wait for.
The setup
We were migrating backend services from a legacy message queue to Kafka. The new consumers ran side by side with the old ones in a “shadow mode.” That let us compare behavior before the real cutover. Part of that work meant pointing a dev environment at a managed Kafka cluster. (Think AWS MSK – the specifics don’t matter here.) We also updated the broker endpoint in config. In shadow mode we send to both old and new queues, but only one of them processes the message. The other queue infrastructure just logs what it receives.
The change looked trivial: swap one connection string for another, restart the pods, watch them come up. Instead, every pod that touched Kafka went straight into a crash loop. The only clue was that single “Loading config” line. Repeated forever.
Why “no error” is the error
The instinct when a service crashes is to look for what it logged right before dying. Here that instinct is a trap. The absence of any further log output isn’t a hint – it’s the symptom itself. Two things had to be true simultaneously for this to happen:
- Something blocked the process long enough that Kubernetes’ health checks gave up on it and sent
SIGKILL. - Whatever the process wanted to log about being blocked never made it out of its internal buffers before the kill.
That second point matters more than it looks. Go’s standard logger writes to os.Stdout. How a container runtime attaches to that stream determines whether output appears immediately or sits in a buffer. Buffering is common under load, or when the write target isn’t a real TTY. Consider a process blocked inside a library call, say dialing a broker. It never gets back to the point in its code where it would flush or print the next line. SIGKILL doesn’t give a process the chance to clean up. Whatever was sitting in a buffer is gone. From the outside, a service that’s actually deep in a hung network call looks identical to one that exited silently. Both just print “Loading config” and stop.
The lesson here generalizes past Kafka. If a container’s logs stop dead with no error and no clean shutdown message, assume a hang-then-kill. Not a fast crash. Until proven otherwise.
Reaching for the network layer
Once “look at the application logs” stopped being useful, the next step was to get underneath the application entirely. Shelling into a node and watching the raw traffic (tcpdump) tells you what actually happened at the OS level. So does tracing the process’s syscalls with strace. Neither depends on whether the application ever got to log anything about it.
What that showed: a TCP handshake that started and never finished. A SYN packet went out toward the broker; no SYN-ACK ever came back, and critically, no RST came back either. That distinction is the whole story.
- Connection refused is fast and loud. The remote host, or a firewall in front of it, actively sends back an RST packet. Your client’s
connect()call fails almost immediately. - Connection blackholed is slow and silent. Packets go out and nothing comes back. The OS has no way to know if the remote end is down, unreachable, or just very far away. So it retransmits the SYN a few times with exponential backoff, then gives up. The kernel’s default TCP connect timeout can be well over a minute.
In this case, the broker endpoint we’d configured was a private, VPC-internal address. It was reachable from some parts of the network, but not from the specific node group these pods landed on. No security group or routing rule was actively rejecting the connection – the packets were simply going nowhere. That’s the worst kind of network failure to debug from inside an application. Everything about it looks like the process is just slow, right up until it isn’t.
Where the health check made things worse
None of this would have been quite so opaque if the failure had surfaced immediately. But the service’s startup path connected to Kafka before reporting itself healthy. On top of that, the Kubernetes startup probe carried a generous timeout, meant to avoid flapping on slow boots. That combination left the platform with no opinion about what was wrong. It just saw a container that hadn’t become healthy in time. So it did the only thing it can do here: kill it and try again.
The pod restart count climbed. The backoff delay between restarts grew too – Kubernetes doubles it after repeated failures, up to roughly five minutes. Every fix we tried afterward seemed to take forever to take effect. That’s because we were still watching a container that hadn’t actually restarted yet. It was just waiting out its backoff window. Deleting the pod outright forced an immediate restart. That turned out to be the fastest way to test each hypothesis, rather than waiting for the backoff timer.
The fix, and the more useful part
The actual fix was almost anticlimactic: switch to the broker’s public endpoint. In a real production setup, you’d instead fix the VPC routing or peering. That makes the private endpoint reachable from every node group that needs it. Once the TCP path was real, the connection succeeded instantly and the crash loop stopped.
The useful part isn’t the fix. It’s the checklist that could have saved us time:
Handy Checklist
- Treat “one log line then silence” as a hang, not a crash. A clean crash logs an error. A silent one usually means something upstream killed the process mid-blocking-call.
- Go to the network layer early, not last.
tcpdumporstraceon the affected node will show you a stuck SYN in seconds. That’s far faster than adding print statements and waiting through several crash-loop cycles. - Know the difference between “refused” and “blackholed” in your bones. An RST means someone answered and said no. Check credentials, ports, and application-level config. Silence means the packet never arrived. Check routing, VPC peering, security groups, and whether you’re using the right endpoint for the network you’re actually in.
- Set explicit, short connect timeouts in your client libraries. Don’t let a startup path inherit the OS’s default TCP connect timeout. The OS optimizes that default for general robustness, not for failing fast during a health check window.
- Make sure your logger flushes before anything that can block indefinitely. If a call to an external system can hang, log “attempting to connect to X” first. Then make sure that line is actually out the door, synchronously if necessary, before making the call. It costs you nothing when the call succeeds and saves you hours when it doesn’t.
- When you’re mid-debug, delete the pod instead of waiting out the backoff. Kubernetes’ exponential backoff on repeated
CrashLoopBackOffrestarts is helpful in production and actively annoying when you’re iterating on a fix.
None of this is exotic – it’s TCP fundamentals and container basics that everyone technically knows. What makes it worth writing down is how convincingly a blackholed connection disguises itself as an application bug. Right up until you stop looking at the application and start looking at the wire.